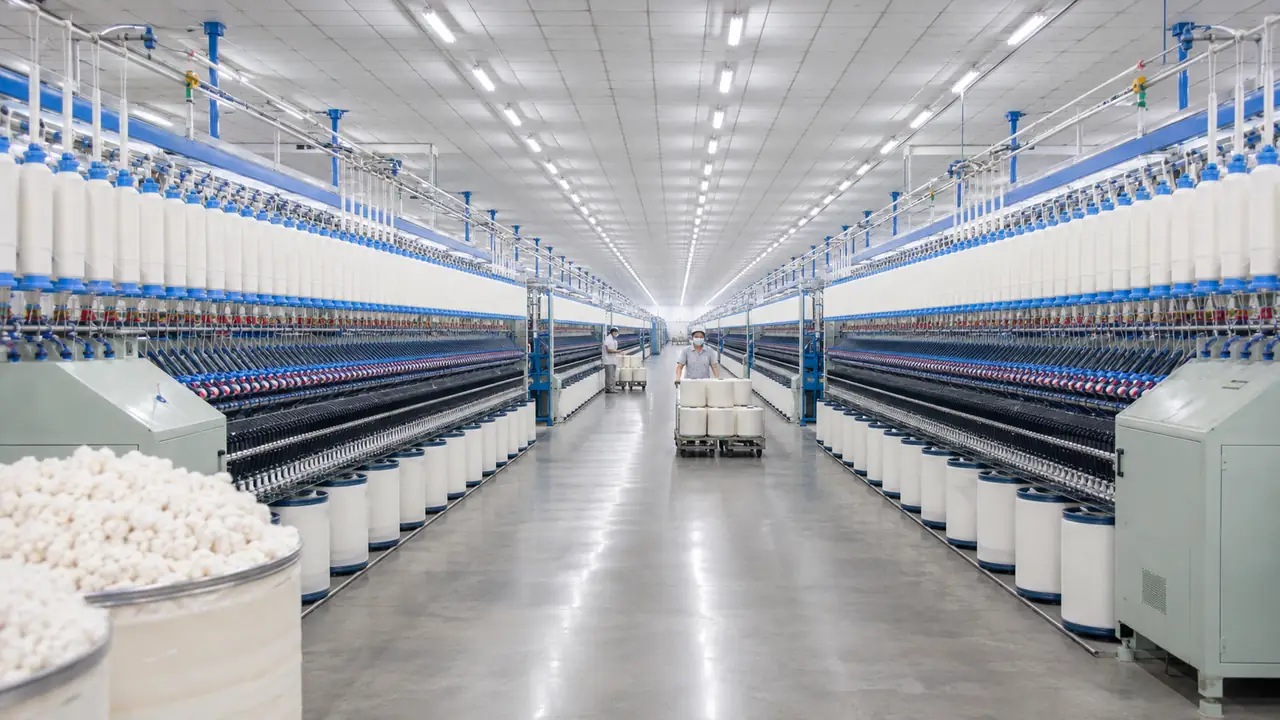

Boost spinning efficiency by mastering fiber physics. This technical guide explains how staple length and fineness influence drafting, yarn strength, end breaks and Overall Equipment Effectiveness (OEE).
The important qualification is that fibre properties influence these results; they do not determine them alone. Maintenance, machinery condition, settings, components, suction, atmospheric conditions, operator response and product requirements also affect spinning performance.
A new cotton laydown can appear on the ring frame as more ends down, unstable yarn evenness, higher imperfections or greater hairiness. Length and Micronaire are often blamed first. That may be directionally correct, but it is not a complete diagnosis.
For cotton, the practical question is not whether longer or finer fibre is always better. The question is whether the length distribution, fineness, maturity, strength and variation of the laydown are suitable for the yarn count, spinning system and end use—and whether the suspected fibre change explains a measured spinning-efficiency loss.
The short answer is:
- Fibre length and length distribution influence drafting behaviour, yarn-count potential, strength, evenness, hairiness and running performance.
- Micronaire is influenced by both fibre fineness and maturity. It is not a direct fineness result by itself.
- Neither length nor Micronaire can predict spinning efficiency or OEE alone.
- Machine settings should be validated through a controlled trial using the mill’s material, machine configuration and product requirements.
This guide focuses on cotton short-staple spinning. Man-made staple fibres and wool require different property definitions and control limits. For the wider production context, see the complete textile manufacturing process guide.
Scope note: This is a decision framework, not a machine-setting recipe. Roller gauges, draft, pressure, spacers, twist, spindle or rotor speed, travellers and other components must remain within machinery and component-supplier limits and must be validated by an authorised spinning technologist.
What does spinning efficiency mean?
“Spinning efficiency” is used in more than one way. A mill may use it for machine efficiency, productive spindle time, end-break performance, delivery against standard production or a broader OEE calculation. Peer-reviewed cotton research has also used ends down as one measure of spinning efficiency. These measures are related, but they are not interchangeable.
For this article, use the following working definition:
Spinning efficiency is the ability to convert scheduled production time into acceptable yarn at the intended count and operating condition, with controlled stops, speed loss, waste and quality loss.
Every mill should document its exact numerator, denominator, planned exclusions and reason codes before comparing machines, counts, shifts or fibre mixes.
How fibre properties influence spinning efficiency and OEE
ISO 22400-1 provides an industry-neutral framework for manufacturing key performance indicators. A Siemens OEE application guide expresses Overall Equipment Effectiveness as:
OEE = Availability × Performance × Quality
Fibre properties can contribute to losses inside these factors, but the classification of each event depends on the mill’s time model and data rules.
Availability: was the machine able to run?
Possible fibre connection: Repeated ends down, lapping, choking or cleaning interventions may create recorded downtime if they exceed the mill’s stop threshold.
Other causes to separate: Mechanical faults, electrical stops, planned maintenance, doffing, material waiting, power and utility interruptions.
Check: Downtime duration and reason codes—not only the final OEE percentage.
Performance: did the machine run at the intended rate?
Possible fibre connection: A difficult laydown may require a validated speed reduction, or it may create small stops and unstable running that reduce effective output.
Other causes to separate: Worn components, incorrect settings, drive or suction limitations, operator practices and unrealistic standard speed.
Check: Actual versus approved speed, small-stop history, production per position and count-specific standard production.
Quality: how much acceptable yarn was produced?
Possible fibre connection: Length distribution, fineness, maturity and strength can affect yarn evenness, imperfections, hairiness, tenacity and waste.
Other causes to separate: Preparation variation, twist, drafting components, piecing, clearer settings, contamination and testing error.
Check: Accepted yarn output using a defined quality boundary. Do not treat every gram of produced yarn as good output.
The practical lesson is simple: fibre physics can help explain why spinning efficiency changed, but OEE must be decomposed before assigning the cause.
Diagnose the spinning-efficiency loss before changing settings
Do not start with a setting change. First define what changed and when.
Record the affected yarn count, raw-material mix, spinning route, machine group, shift, start and end time, and downstream product. Then compare the new condition with a stable reference period.
The initial questions should be:
- Did the problem begin with a bale, lot or laydown transition?
- Is the change visible in raw-material, sliver, roving and yarn data, or only at end spinning?
- Are more ends down accompanied by changes in yarn evenness, imperfections, hairiness, tenacity or elongation?
- Is the problem common to several machines or concentrated on one machine, side or position group?
- Did maintenance, ambient conditions, suction, components, speed, twist or count change at the same time?
This sequence matters because a fibre-property correlation does not prove that the fibre is the root cause.
How staple length affects spinning efficiency
The ITMF-ICCTM and CSITC interpretation guideline treats Upper Half Mean Length, Uniformity Index and Short Fiber Index as related but different views of the fibre-length distribution. A single average cannot replace all three.
Upper Half Mean Length: the longer half of the beard
Meaning: Upper Half Mean Length (UHML) is the average length of the longer half of the fibres in the prepared fibre beard. HVI reports it in millimetres or decimal inches, depending on the system and market.
Why it matters: UHML helps indicate the yarn-count range, drafting geometry and processing route for which the cotton may be suitable. It also relates to yarn strength and running behaviour, both of which can influence spinning efficiency.
Limitation: Two laydowns can have a similar UHML but different proportions of short fibres. Their drafting and yarn results may therefore differ.
Uniformity Index: the spread behind the average
Meaning: Uniformity Index is calculated as mean length divided by UHML, multiplied by 100.
Why it matters: A lower result indicates a wider length distribution relative to UHML. That can reduce control of fibres through drafting and can affect yarn evenness and strength.
Limitation: Interpret Uniformity Index with UHML and the instrument method. Do not copy a universal acceptance limit from another mill, cotton growth or product route.
Short Fiber Index and short-fibre content: confirm the method
Meaning: Short Fiber Index (SFI) and short-fibre content (SFC) quantify the short end of the distribution, but the result can be calculated or measured on different bases. HVI and AFIS reports may not be directly interchangeable.
Why it matters: Short fibres are less consistently controlled in a drafting field. A higher short-fibre component can contribute to unevenness, imperfections, hairiness and ends down, creating performance or quality losses that reduce spinning efficiency.
Check before comparing: Record the instrument, software, cut-off length, number or weight basis, specimen preparation and conditioning. USTER’s current AFIS 6 specification, for example, can report short-fibre content by number or by weight and can use specified cut-off lengths.
Do not do this: Do not claim that a fixed rise in SFC will produce a fixed efficiency loss. The effect depends on the starting distribution, count, route, preparation quality, machine condition and settings.
How fibre fineness and Micronaire affect spinning efficiency
The USDA cotton-classing service describes Micronaire as a combination of fibre fineness and maturity. The result comes from the air permeability of a compressed cotton specimen.
That creates an important diagnostic limitation:
- A lower Micronaire result can represent finer fibre, less mature fibre, or a combination.
- A higher result can represent coarser fibre, more mature fibre, or a combination.
- Cottons with the same Micronaire can have different fineness and maturity combinations.
Finer fibre can increase the number of fibres in a yarn cross-section at the same yarn linear density. That can support finer counts and yarn uniformity. Immature fibre, however, can behave differently during opening and carding and can increase nep and dye-appearance risk. A low Micronaire value should therefore not be interpreted as automatically desirable or as a guarantee of higher spinning efficiency.
When the distinction matters, use a method that reports fineness and maturity separately. USTER lists AFIS process-control results for single-fibre length, fineness and maturity, while HVI is used for bundle properties and cotton classification. These are complementary data sources, not interchangeable labels.
A useful cross-section calculation—with a clear limitation
The theoretical number of fibres in a yarn cross-section can be screened from linear density:
Estimated fibres in cross-section = yarn linear density (tex) ÷ individual-fibre linear density (tex)
Worked assumption:
- Yarn linear density = 20 tex
- Directly measured individual-fibre linear density = 0.16 tex
- Estimated fibres in cross-section = 20 ÷ 0.16 = 125
This is a transparent calculation, not a specification. It does not account for count variation, fibre migration, packing, twist structure or the maturity ambiguity contained in Micronaire. Use direct fineness data where available and validate the practical spinning limit with trials. Do not turn 70, 80 or any other fibre count into a universal pass/fail rule.
Why length distribution affects drafting and yarn strength
In a roller drafting system, fibres need controlled contact while the strand is attenuated. The relevant setting depends on the fibre-length distribution, not only the longest fibres or the UHML average.
If a roller distance is too wide for the material and drafting arrangement, more fibres may become insufficiently controlled, increasing mass variation. If it is too narrow, fibres may be stressed or damaged. The CSITC guideline therefore links length results with drafting parameters but does not provide one universal roller gauge.
The same guideline identifies length, uniformity, strength, maturity, fineness and cleanness as properties whose relative importance changes with the spinning system. Length is particularly important for ring-spun yarns, while strength is given greater priority for rotor and air-jet systems. This is a prioritisation framework, not a substitute for mill trials.
Use HVI and AFIS to control spinning efficiency
Use HVI for bale classification and laydown control
Best for: High-throughput comparison of bale or lot properties.
Typical outputs: Micronaire, UHML, length uniformity, bundle strength, colour and trash, depending on instrument configuration.
Mill decision: Is the cotton within the approved procurement and laydown window, and is variation controlled within and between laydowns?
Limitation: Averages can conceal the distribution and cannot always separate fineness from maturity.
Use AFIS for fibre-distribution and process diagnosis
Best for: Understanding single-fibre distributions and changes through fibre preparation.
Typical outputs: Length by number or weight, short-fibre content, fineness, maturity, neps, seed-coat neps, trash and dust, depending on instrument configuration.
Mill decision: Did the distribution or nep level change between the bale, blowroom, card, drawing or combing stages?
Limitation: Sampling, specimen preparation, instrument configuration and cut-off definitions must be consistent before results are compared.
Five spinning-efficiency problems to diagnose
1. Ends down increased after a laydown change
Possible meaning: The new mix may have a shorter or less uniform length distribution, lower strength, different Micronaire or greater between-bale variation.
Check: UHML, Uniformity Index, SFI/SFC, strength, Micronaire range and variation—not just laydown averages. Compare roving and yarn evenness, imperfections, hairiness, tenacity and elongation with the previous stable mix.
Containment: Preserve traceability, separate affected production and avoid mixing additional variables into the diagnosis.
Action: Confirm the material difference first. If a setting trial is justified, follow the machine and component suppliers’ approved ranges and change one controlled factor at a time.
2. Micronaire decreased and neps increased
Possible meaning: The cotton may be finer, less mature or both. Immaturity may be more relevant than fineness to the nep increase.
Check: Separate maturity and fineness where possible. Review fibre neps before and after opening and carding, along with card waste and yarn neps.
Containment: Avoid blending an unverified outlier across additional laydowns.
Action: Review laydown construction and fibre-preparation performance before assuming that ring-frame pressure, spacer or speed is the primary correction.
3. Micronaire increased and the fine-count margin narrowed
Possible meaning: If the change represents genuinely coarser fibre, the yarn may contain fewer fibres in its cross-section at the same count.
Check: Direct fineness where available, maturity, yarn count, count variation, tenacity, unevenness and ends down.
Containment: Do not force the existing count-speed combination merely because the average Micronaire remains inside a purchasing range.
Action: Reassess count suitability and laydown design. Validate any production change through a controlled trial.
4. Laydown averages look stable but quality drifts
Possible meaning: The mean can remain stable while the bale-to-bale range, standard deviation or transition between laydowns changes.
Check: Plot each important fibre property by bale and by laydown sequence. Compare the mean, range and variation, and trace the timing into sliver, roving and yarn results.
Action: Improve mixing consistency and transition control. A stable average is not sufficient if neighbouring bales or laydowns vary sharply.
5. Length and Micronaire are stable but spinning deteriorates
Possible meaning: The root cause may be elsewhere in the material or process.
Check: Fibre strength, trash, contamination, moisture, neps, card and draw-frame performance, roving variation, cots and aprons, roller condition, suction, twist, travellers, piecing, ambient conditions and maintenance history.
Action: Use machine-wise and position-wise evidence to separate a raw-material problem from a preparation, component, maintenance or operating problem.
How to run a controlled spinning-efficiency trial
Step 1: Freeze the reference
Record the current approved mix, yarn count, process route, machine configuration, settings, components and atmospheric condition. Define a stable comparison period and save the original settings.
Step 2: Write one hypothesis
Example: “The increase in ends down is associated with a wider short-fibre distribution after the laydown change.”
Avoid a vague statement such as “the cotton is poor.” The hypothesis should identify the suspected input, the mechanism and the measurable output.
Step 3: Select one controlled change
Choose the smallest authorised change that tests the hypothesis. Do not simultaneously alter roller gauge, break draft, spacer, pressure, twist, speed and traveller. Multiple changes may improve the result but destroy the diagnosis.
Step 4: Define the comparison metrics
Use the same test methods, conditioning, sample length and denominator for both conditions. Do not report that spinning efficiency improved from one favourable indicator while ignoring quality, waste or production. Depending on the route, monitor:
- ends-down rate using the mill’s documented denominator;
- production and machine efficiency;
- yarn count and count variation;
- unevenness and imperfections;
- hairiness;
- tenacity and elongation;
- joints or clearer cuts where relevant;
- pneumafil, hard waste and other waste streams using defined boundaries; and
- energy per kilogram of accepted yarn if energy is part of the decision.
Step 5: Release, refine or roll back
Accept a change only when the running result, yarn quality and downstream requirement improve together. A local reduction in end breaks is not a success if it creates excess twist, lower production, higher hairiness, weak yarn or downstream faults.
Procurement and laydown checklist
- Define the yarn count, spinning system, carded or combed route and downstream end use before setting cotton requirements.
- Use mill-validated operating windows rather than copying another mill’s specification.
- Control variation within and between laydowns, not only the average value.
- Compare UHML with Uniformity Index and SFI/SFC.
- Interpret Micronaire with maturity and direct fineness when the distinction affects the decision.
- Include strength, trash, contamination, moisture and neps in the diagnosis.
- Confirm that results being compared use compatible instruments, specimen preparation, conditioning and cut-off definitions.
- Trace bales and laydowns through sliver, roving, yarn and fabric outcomes.
- Review mechanically recycled cotton separately because tearing changes fibre-length distribution and short-fibre content. Use virgin-cotton limits only after validation.
- Require an authorised spinning technologist to approve machine-setting changes.
Standards and source note
Use the USDA cotton-classing pages for official U.S. classification terminology and the ITMF-ICCTM/CSITC guideline for interpretation of instrument results. Use the current manual for the installed HVI, AFIS or equivalent system to confirm parameter names, sampling and cut-off definitions.
ISO 3060:1974 remains current after confirmation in 2025, but its scope is the determination of breaking tenacity of flat bundles of cotton fibres. It is not a length, Micronaire or HVI-interpretation standard. Consult the licensed standard and the buyer’s specified test method when a formal test requirement applies.
Final takeaway: improve spinning efficiency with evidence
Cotton length and Micronaire influence spinning efficiency, but averages do not operate a mill. The useful decision comes from combining the length distribution, maturity, fineness, strength and variation with the actual yarn count, spinning route and machine condition.
Measure the loss, decompose OEE where it is used, confirm the mechanism, run one controlled trial and judge the result on accepted yarn—not on a single fibre number or a generic setting rule.