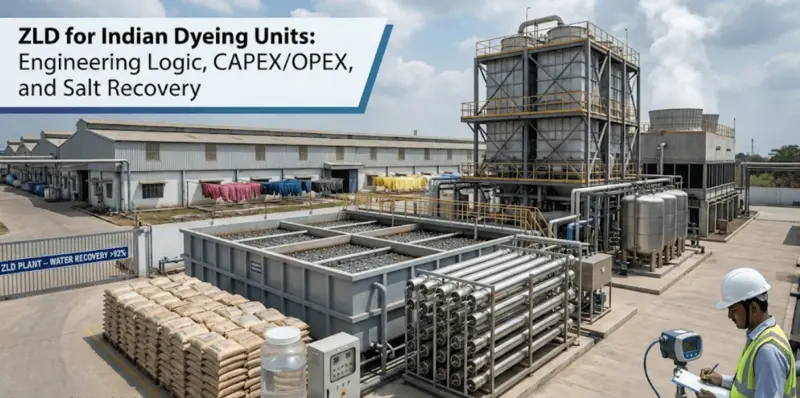
For Indian textile dyeing and processing units—especially in hubs like Tirupur, Ludhiana, and Pali—Zero Liquid Discharge (ZLD) is no longer a “green badge.” It is an operating license. With OCEMS/online monitoring and tighter scrutiny of red-category discharge in many clusters, the real question has shifted from “Do we need ZLD?” to:
“What will ZLD cost us every month, in ₹/KL treated—and what design choices decide that cost?”
Most ZLD decisions fail because teams focus on CAPEX (plant price) and ignore OPEX (power, steam, chemicals, membranes, manpower, sludge/salt handling). Two plants with the same capacity can run at 2–4× different ₹/KL simply due to wrong assumptions on RO recovery, evaporation technology selection (MEE/MVR/ATFD), and concentrate/salt disposal strategy.
This guide breaks ZLD into an engineering logic you can actually use:
- CAPEX vs OPEX: where vendors quote, and where the real bill appears later
- ₹/KL cost drivers: which block spikes operating cost in real mills
- Salt recovery & final 5% problem: why “high recovery” is achievable, but concentrate handling kills margins
- Vendor checklist: questions that expose hidden costs before you sign
If you’re evaluating a new ZLD project or trying to reduce an existing plant’s operating cost, this page will help you make the only decision that matters: a system that stays compliant without turning ₹/KL into a permanent profit leak.
Key Takeaways: The 2025-26 Snapshot
- CAPEX Benchmark: Approx. ₹1.5 – ₹2.0 Crores per 100 KLD capacity (varies by TDS load).
- OPEX Reality:
- <500 KLD (MEE based): ₹120 – ₹180 per KL.
- >1 MLD (MVR based): ₹75 – ₹110 per KL.
- Water Recovery Target: Minimum 92% to make the system viable.
- Power Consumption: 12–18 kWh/m³ for optimized systems (MVR + RO).
Defining the Scope
This guide differentiates between two distinct operational scales common in India:
- The Job-Worker (<500 KLD): Typically running batch reactive dyeing on knitwear. Space-constrained. Relies on Multi-Effect Evaporators (MEE) or shared CETPs.
- The Integrated Mill (>1 MLD): Continuous dyeing (CPB/Thermosol) + Batch. High capital ability. Uses Mechanical Vapor Recompression (MVR) and automated salt recovery.
The Feedwater Challenge: Cotton & PC Blends
In ZLD engineering, the “design basis” is everything. If you underestimate the Total Dissolved Solids (TDS) or Chemical Oxygen Demand (COD) loading at the inlet, your RO membranes will choke within weeks. For Indian mills processing Cotton and PC (Polyester-Cotton) blends, the influent profile is notoriously aggressive.
The “Reactive” Trap (100% Cotton)
Cotton dyeing using Reactive Dyes is the primary cost-driver for ZLD in India.
- The Salt Load: Reactive dyeing requires massive electrolytes for exhaustion. A typical recipe uses 60–100 g/L of Glauber’s Salt (Na2SO4) or Common Salt (NaCl). Even with “Low Salt” dyes, the specific salt consumption remains high.
- The Consequence: While the dye bath itself has a TDS of ~80,000 ppm, the composite effluent (mixed with wash water) typically hits the ETP at 5,000 – 8,000 ppm TDS.
- The Color Issue: Reactive dyes have a hydrolysis rate of 20–30%. This means nearly a third of the dye goes down the drain, creating high Color units (Pt-Co scale) that must be oxidized before reaching the membranes.
The “PC Blend” Complication
PC blends introduce a chemical conflict. Polyester is dyed in an acidic medium (pH 4.5–5.5) using Disperse dyes, while Cotton is dyed in alkali (pH 10.5–11.0).
- Oligomers: The high-temperature dyeing of polyester (130 deg) releases oligomers (trimer dust). If not filtered out during pre-treatment, these waxy substances irreversibly foul RO membranes.
- Hydraulic Load: PC blends often require double-bath processes, if we consider low MLR machine still the water consumption is higher per kg of fabric (100–120 L/kg vs 60–80 L/kg for pure cotton), putting stress on the hydraulic capacity of the ZLD.
Typical Inlet Parameters (Design Basis)
Parameters measured at Equalization Tank (Composite Stream)
| Parameter | 100% Cotton (Reactive) | PC Blend (Disp/React) | Impact on ZLD |
| pH | 9.0 – 11.0 (Alkaline) | 7.5 – 9.5 (Variable) | Requires Acid Dosing for Neutralization. |
| TDS | 4,500 – 8,000 mg/L | 3,500 – 6,000 mg/L | Determines RO Pressure & Recovery %. |
| COD | 1,200 – 1,800 mg/L | 1,500 – 2,500 mg/L | High fouling potential; needs aggressive bio-treatment. |
| Hardness | 100 – 300 ppm | 100 – 300 ppm | Scaling risk (Ca/Mg precipitates). |
Tech Note: Successful ZLD units do not mix streams blindly. They practice Stream Segregation. The high-TDS “Salt Stream” (Dye bath + 1st wash) is often treated separately from the low-TDS “Wash Stream” to reduce the size of the desalination plant.
The ZLD Technology Stack
In Indian textile hubs, the ZLD system is often referred to as “The Train.” If one carriage fails, the entire line stops. The goal is simple: recover water cheaply in the early stages to minimize the volume reaching the expensive thermal stage.
Stage 1: Pre-treatment
You cannot feed raw textile effluent to a membrane; it will foul instantly. The pre-treatment stage must degrade organics (COD) and remove color.
- The Standard: MBBR (Moving Bed Biofilm Reactor). Unlike the old Activated Sludge Process (ASP), MBBR uses floating plastic carriers to host bacteria. It is robust, handles shock loads of COD better, and requires 40% less tank volume.
- The Upgrade:MBR (Membrane Bioreactor). Used by premium mills (>1 MLD). It replaces the secondary clarifier with submerged membranes.
- Pro: Produces silt-free water (SDI < 3), perfect for RO feed.
- Con: High CAPEX and sensitive to “gumming” from textile sizes.
Stage 2: Membrane Filtration
This is where 90% of your water is recovered. The efficiency of this stage dictates your profitability.
- Ultrafiltration (UF): The “Bodyguard.” It removes suspended solids, colloids, and viruses.
- Reverse Osmosis (RO) Stages 1 & 2: Standard spiral-wound membranes.
- Target: Recovery of 80–85%.
- Pressure: 15–20 Bar.
- The “High-Pressure” RO (HPRO/DTRO): The game changer for 2025.
- Instead of sending Stage 2 reject (TDS ~35,000 ppm) directly to the evaporator, mills now use Disc Tube RO (DTRO) or High-Pressure RO operating at 60–80 Bar.
- Result: Squeezes recovery to 92–95%, reducing the volume of water sent to the evaporator by half. This is the single biggest ROI upgrade available today.
Stage 3: Thermal Evaporation
This stage handles the “brine” (High TDS reject). It consumes huge amounts of energy to boil water.
Option A: MEE (Multi-Effect Evaporator)
- Mechanism: Uses steam in a series of vessels (effects). 4-Effect or 5-Effect is standard.
- Best For: Smaller units (<500 KLD) or mills with excess boiler steam/coal access.
- Cost Reality: Steam cost (coal/wood) is volatile. Current operational cost: ₹600–800 per m³ of reject.
Option B: MVR (Mechanical Vapor Recompression)
- Mechanism: Uses a giant centrifugal fan to re-compress vapor, acting as its own heat source. Runs on Electricity, not Steam.
- Best For: Large units (>1 MLD).
- ROI: CAPEX is 2x of MEE, but OPEX is 60% lower.
- Energy: ~25–35 units (kWh) per m³ of evaporation.
Quick Select: The “Scale” Matrix
| Feature | Small Unit (<500 KLD) | Large Mill (>1 MLD) |
| Biology | MBBR + Tube Settler | MBR (Membrane Bioreactor) |
| RO Tech | 2-Stage RO + Nano Filtration | 3-Stage RO + HPRO (95% Rec) |
| Thermal | 3-Effect MEE (Steam) | MVR (Electricity) |
| Sludge | Solar Drying / Bag Filter | Auto Filter Press + Centrifuge |
Sludge Management & Solid Waste (Critical Compliance)
In the ZLD ecosystem, “Water Recovery” is the hero, but “Sludge” is the villain. If not managed, sludge storage costs can exceed the value of recovered water. Indian State Pollution Control Boards (SPCBs) track this via the Hazardous Waste Manifest System (Form 10).
The Three Waste Streams
You are not generating one type of waste; you are generating three, each requiring a different disposal path.
- Chemical Sludge (Hazardous – Cat 34.3):
- Source: Primary Tube Settler / Clarifier.
- Composition: Lime, Ferrous Sulphate, and Polymer coagulants.
- Volume: High. Approx 0.8 – 1.2 kg of dry sludge per kg of fabric processed (if using conventional chemical precipitation).
- Disposal: Sent to Secure Landfill (TSDF).
- Biological Sludge (Non-Hazardous/Restricted):
- Source: Aeration Tank / MBR.
- Composition: Dead bacteria (Biomass).
- Tech Note: Must be dewatered separately. Mixing it with chemical sludge increases the total hazardous volume, inflating disposal costs.
- MEE Salts (The Nightmare):
- Source: The final scraper of the Multi-Effect Evaporator or ATFD (Agitated Thin Film Dryer).
- Composition: A dirty mix of NaCl (Common Salt) and Na₂SO₄ (Glauber’s Salt).
- Status: Unless you have a Fractional Crystallization system (expensive), this “Mixed Salt” is essentially hazardous waste. It cannot be reused in dyeing because the ratio of salts is unknown and unstable.
Disposal Economics
As of early 2026, typical costs in Western & Southern India:
| Disposal Method | Suitability | Cost (₹/Ton) |
| TSDF (Landfill) | Chemical Sludge & Mixed Salts | ₹1,800 – ₹2,800 + Transport |
| Co-Processing | High CV Sludge (>2500 kCal) | ₹800 – ₹1,500 (Cement Kilns) |
| Vermicompost | Pure Bio-Sludge only | Negligible / Revenue generating |
Technology Focus: Dewatering
To reduce disposal fees, you must reduce weight (moisture).
- Filter Press: The industry standard. Delivers cake with 60–65% moisture.
- Decanter Centrifuge: Best for bio-sludge. Continuous operation but higher power cost.
- Solar Sludge Drying (Polyhouse):
- Strategy: Spread filter press cake in a glass-covered drying bed.
- Result: Reduces moisture from 65% $\rightarrow$ 20%.
- ROI: Drops disposal weight by ~50%, halving your TSDF bill.
Many consultants promise “Salt Recovery” for small units. Be warned: Recovering reusable Glauber’s Salt requires freezing crystallization (chilling to $10^\circ C$), which demands massive CAPEX. For units <500 KLD, it is often cheaper to landfill the mixed salt than to try and separate it.
The “Mixed Salt” Trap: Many consultants promise “Salt Recovery” for small units. Be warned: Recovering reusable Glauber’s Salt requires freezing crystallization (chilling to $10^\circ C$), which demands massive CAPEX. For units <500 KLD, it is often cheaper to landfill the mixed salt than to try and separate it.
Where ZLD Fails
Consultants sell ZLD diagrams; mill owners manage the breakdowns. The theoretical design often crashes when it meets the chaotic reality of a dye house floor. Based on operational audits in Tirupur and Surat, here are the three most common failure points.
1. The “Silica Ceiling” (The Silent Killer)
In many Indian textile clusters (especially Tamil Nadu and Rajasthan), groundwater has high Reactive Silica (SiO2).
- The Failure: As you recover water in the RO stage, silica concentrates. Once it crosses 150–200 ppm in the reject stream, it polymerizes into a glass-like glaze on the membrane surface.
- The Symptom: Irreversible drop in permeate flow. Standard acid cleaning (CIP) cannot remove silica scale.
- The Fix: You must check your raw water silica. If it is high (>20 ppm), you need a specialized “High pH” RO cleaning protocol or a chemical silica dispersant dosing system.
2. Bio-Fouling: The Result of “Cheating” Biology
Mills often push more flow through the biological stage (MBBR/MBR) than designed to save space.
- The Failure: Incomplete COD degradation leads to “bio-slime” entering the RO.
- The Metric: If your SDI (Silt Density Index) at the RO inlet is > 3.0, your pre-treatment is failing.
- The Consequence: RO feed pressure spikes (Differential Pressure $\Delta P$ rises). You end up cleaning membranes every week instead of every month, halving their lifespan (from 3 years to 1.5 years).
3. The “Pure Salt” Illusion
Recovering salt sounds profitable: “We will reuse the Glauber’s Salt for dyeing!”
- The Reality: To get reusable salt, you need Fractional Crystallization, which separates Sodium Sulphate (Dyeing salt) from Sodium Chloride.
- The Problem: This technology requires precise temperature control and immense energy. Most basic MEEs (Multi-Effect Evaporators) produce a “Mixed Salt” sludge (brownish, wet, impure).
- The Outcome: Using this mixed salt in dyeing causes uneven dyeing patches (reprocessing loss). 90% of mills end up landfilling this salt rather than reusing it, killing the projected ROI.
Insider Tip: The “Bypass” Valve Risk.
Regulators now monitor the Power Consumption of your ZLD vs. your Production Volume. If you produce 10 tons of fabric but your ZLD power meter shows low usage, the SPCB automated algorithms flag you for “illegal bypass.” The era of turning off the ZLD at night is over.
CAPEX & OPEX :The ROI Picture
This is the section where Engineering meets Finance. In the Boardroom, the discussion isn’t about “Reverse Osmosis flux rates”; it’s about the Cost Per Cubic Meter ($/m^3$) of recovered water versus purchased water.
As of early 2026, the gap has narrowed. While tanker water in industrial clusters (Tirupur/Surat) hovers around ₹80 – ₹100 per KL, optimized ZLD systems can recover water at ₹75 – ₹110 per KL. The “Green Premium” is disappearing.
CAPEX Benchmarks (Initial Investment)
Estimates for “Greenfield” projects including Civil, Mechanical, and Electrical works.
| Capacity | Tech Configuration | Estimated CAPEX (₹ Crores) | CAPEX per KLD (₹ Lakhs) |
| 100 KLD | MEE (Steam) + Standard RO | ₹1.6 – ₹2.1 Cr | ₹1.6 – 2.1 L/KLD |
| 500 KLD | MEE + HPRO (High Pressure RO) | ₹6.5 – ₹7.5 Cr | ₹1.3 – 1.5 L/KLD |
| 1 MLD (1000 KLD) | MVR (Elec) + HPRO + ATFD | ₹12 – ₹14 Cr | ₹1.2 – 1.4 L/KLD |
Insight: The “Economy of Scale” is massive in ZLD. A 1 MLD plant is cheaper to build (per liter) because MVR technology becomes viable only at larger scales, eliminating the need for massive boilers and steam piping.
OPEX Breakdown: The Daily Burn
Where does the money go?
- Power (45%): High-pressure pumps and blowers.
- Steam/Fuel (35%): Thermal evaporation (if using MEE).
- Chemicals (15%): Polyelectrolytes, Antiscalants, Acids.
- Consumables (5%): Cartridge filters, Membrane replacement (amortized).
The Cost Table (₹ per KL of Feed)
| Component | Small Unit (<500 KLD) (MEE Based) | Large Mill (>1 MLD) (MVR Based) |
| Power (₹8-10/unit) | ₹40 – 50 | ₹55 – 65 (Higher electrical load) |
| Thermal Energy | ₹80 – 100 (Steam/Coal) | ₹10 – 15 (Start-up only) |
| Chemicals & Spares | ₹30 – 40 | ₹25 – 35 |
| Labor & Sludge Disposal | ₹20 – 30 | ₹15 – 20 |
| TOTAL OPEX | ₹170 – ₹220 / KL | ₹105 – ₹135 / KL |
The Verdict: Small units paying ₹200/KL for recycled water are technically “losing money” compared to buying fresh water (₹100/KL). However, they have no choice due to statutory compliance. Large mills with MVR, however, are nearing cost parity.
Hidden Costs (The “Gotchas”)
- Membrane Replacement: RO membranes last 2–3 years. Budget 15–20% of membrane CAPEX annually for replacement.
- Anti-Scalant Quality: Using cheap anti-scalant saves ₹2/KL today but costs ₹5 Lakhs in early membrane failure tomorrow.
- Corrosion: High chlorides eat standard SS304 steel. Evaporators must be Titanium or Super Duplex (SS 2205). If a vendor quotes SS316 for the evaporator calandria, reject it immediately.
Future Proofing: Beyond 2026
The definition of ZLD is evolving. Regulators are moving from “Zero Liquid Discharge” (no water out) to “Zero Waste” (resource circularity). For a mill owner investing crores today, the system must remain compliant in 2030.
The Next-Gen Tech Stack
- Forward Osmosis (FO):
- The Concept: Unlike RO which pushes water through a membrane using pressure (energy intensive), FO uses osmotic pressure to pull water across.
- The Benefit: Extremely resistant to fouling. Can handle feed TDS up to 100,000 ppm, potentially replacing the energy-hungry MEE stage in smaller units.
- Status: Pilot stage in India; commercial adoption expected by 2027.
- Solvent-Based Extraction:
- New systems are emerging that extract specific salts (like Glauber’s Salt) from the brine before evaporation, using solvent cooling. This turns “Hazardous Sludge” into “Commercial Grade Salt” with >98% purity.
- Digital Twins & IoT:
- The “Black Box” era is ending. New ZLD plants in Tirupur use real-time IoT sensors to monitor Membrane Health (permeability) and Pump Efficiency.
- Predictive Maintenance: Algorithms predict scaling events 48 hours before they happen, triggering auto-cleaning cycles and saving the membrane from irreversible damage.
The Regulatory Horizon
- The “Carbon” Link: SPCBs are beginning to calculate the Carbon Footprint of ZLD. Since thermal evaporation is carbon-intensive, future regulations may force mills to switch from Coal/Wood fired MEEs to Solar-Thermal or Electrical MVR systems to meet “Net Zero” targets.
Final Thoughts: The ZLD Mindset Shift
For decades, Indian textile mills viewed Effluent Treatment as a “grudge purchase”—a dead investment that added no value to the fabric. ZLD has changed that equation, albeit forcefully.
In 2026, the dyeing unit that survives isn’t the one with the cheapest dyes or the fastest stenters; it is the one with Water Security. When the next drought hits Tamil Nadu or the next NGT order shuts down groundwater extraction in Rajasthan, the mill with a robust, optimized ZLD system will keep running. The others will stop.
Your Action Plan:
- Stop treating ZLD as a “Black Box”: If you are a Mill Owner, you know your Spinning draft and your Dyeing recipe. You must also know your RO Recovery Rate. If you don’t, you are leaking profit.
- Audit Your Sludge: The volume of sludge you generate is the truest indicator of your system’s efficiency. High sludge = Low efficiency.
- Invest in Talent: A ₹10 Crore ZLD plant run by an unskilled operator is a liability. Train your ETP team on membrane chemistry, not just valve turning.
ZLD is no longer about “saving the planet” for the textile industry. It is about saving the factory.
One thought on “ZLD for Indian Textile Mills: CAPEX/OPEX Analysis, and Salt Recovery”
Comments are closed.